Confinement Condition of the Memphis Aquifer – Shelby County
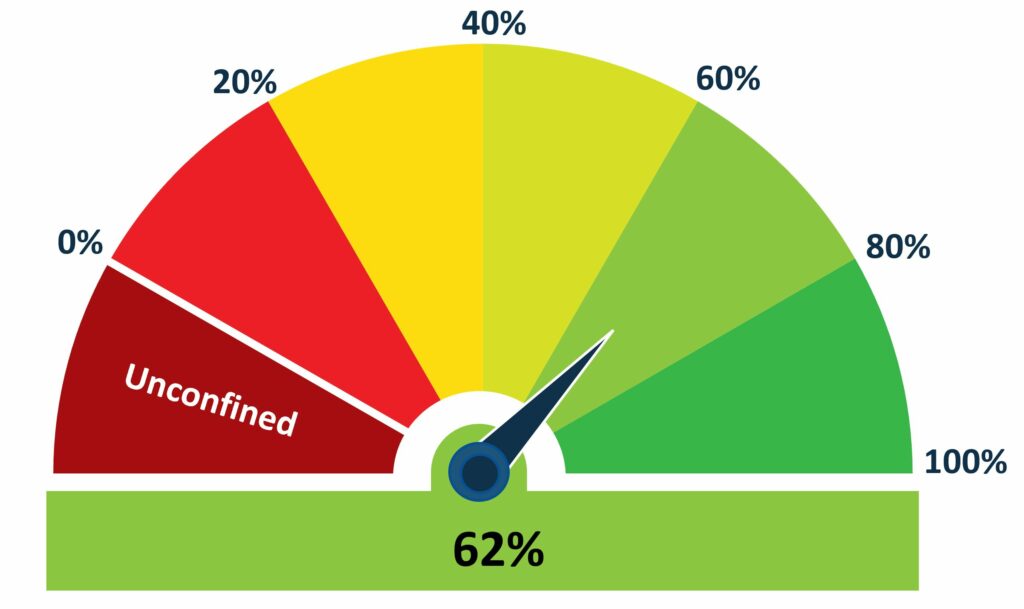
Beneath much of Shelby County, the Memphis aquifer is confined, meaning that water levels in the aquifer sit above the base of the upper confining clay. Water levels in the Memphis aquifer can rise above the aquifer itself when they are under tremendous pressure, such as when they are capped by clay and hundreds of feet of sediment above that. Before local pumping from the aquifer began in 1886 (considered “predevelopment conditions”), water levels likely remained almost unchanged. As pumping has continued and withdrawals have steadily increased since 1886, these levels, known as the potentiometric surface (or potential water height), have dropped. When water levels drop enough to fall below the base of the upper confining clay, the Memphis aquifer goes unconfined, which is an undesirable situation.
Data used in this analysis comes from predevelopment levels by Waldron and Larsen (2015), Memphis aquifer water levels from 2015 by Kingsbury (2018), and geologic formation elevations derived by Van Arsdale (2015).
The percentage represents the height of 2015 Memphis aquifer water levels from the base of the upper Claiborne confining unit (UCCU) compared to the original, pre-development, (1886) water level height above the base of the UCCU, following this equation:
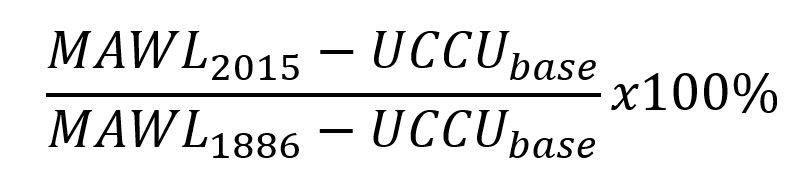
where, MAWLxxxx is the Memphis aquifer water level elevation for that year (xxxx) and UCCUbase is the base elevation of the UCCU.
On the diagram, the arrow falls between 100% and 0% where 100% reflects zero water decline since pumping began in 1886, and 0% says water levels have reached the base of the confining clay and full unconfinement of the Memphis aquifer beneath Shelby County is imminent. The current 62% rating is an average among all 59 available measurements, and indicates that the Memphis aquifer remains mostly confined, meaning the water levels have dropped on average 38% below original predevelopment levels. Of the 59 water level locations surveyed in 2015 by the U.S. Geological Survey, five locations show unconfinement. Calculated values are shown in the following table (highlighted cells are unconfined).